
BY NATE HAKEN
 As the United States heads into a heated political campaign season, candidates are beginning to frame their take on the social, economic, and political track the country is on and what they would do to calibrate those trajectories. Certainly, to listen to pundits you might suppose that the U.S. is either going to hell in a hand-basket or is the rock upon rests the salvation of the world.
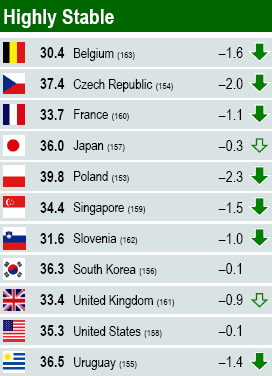
The Fragile States Index is unlikely to resolve that debate. The overall Index score has hardly budged over the last half a dozen years, ranging from a low of 33.5 in calendar year 2012 (Highly Stable) to a high of 35.4 in calendar years 2013-2014 (also Highly Stable). The U.S. may well be reliably highly stable as the overall score suggests. Or the static nature of those total scores could be the product of an additive methodology where countries at either end of the index tend to stay there. Indeed, since calendar year 2005, the most fragile states have always been Sudan, South Sudan, or Somalia. At the other end of the Index, the most stable country has always been either Norway or Finland. Or, on the other hand, (as we would argue) maybe the world really is such that fragility begets fragility and stability, stability.
Either way, a disaggregation of the Index to its composite indicator scores tells a more nuanced story of rising group grievance and factionalized elites in the U.S., masked in the total score by an improving economy and public services.
Group Grievance in the U.S. has increased every year since calendar year 2007. In 2014, an immigration crisis of undocumented children fleeing human insecurity in Central America became a polarizing political issue with competing street protests with ethnic and racial overtones. Meanwhile, protests over alleged police brutality against African Americans gathered steam with the deaths of Eric Garner, Michael Brown, Tamir Rice, and others. Unrest in Ferguson, Missouri was severe enough to result in the deployment of the National Guard in August while pictures and news stories of the protests and riots were broadcast around the globe. The very nature of the accusations and debate regarding the actions by law enforcement that sparked that unrest, with clear racial and socio-economic overtones, has also further contributed to increasing group-based societal fissures.
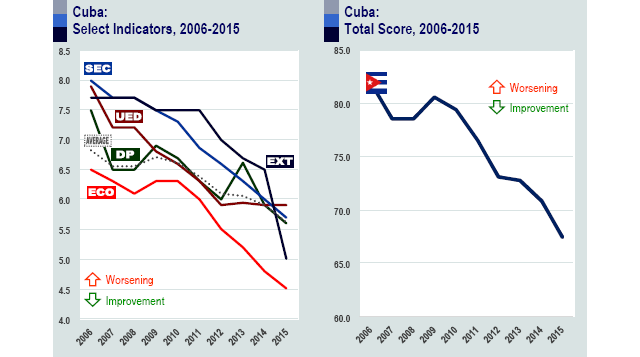
As often occurs when there is a rise in Group Grievance, the score for Factionalized Elites also increased over the last six years. The score peaked in calendar year 2013 with the government shutdown due to a disagreement over the Affordable Care Act and did not come back down in 2014. The 112th and 113th Congress (2011-2014) were the least productive sessions since before 1947 as measured by the number of bills passed into law, according to Brookings Institution’s Vital Statistics on Congressional Data initiative.
On the positive side, the Economy continued to strengthen in 2014. Unemployment, which had peaked at 10 per cent in 2009, has been improving ever since and as of December 2014, was at 5.6 per cent. Public Services also improved in 2014, with the number of uninsured Americans dropping from 17.1 per cent to 12.9 per cent over the course of the year according to Gallup.
As the campaigns begin in earnest in the coming months, there will be many debates and disagreements about the reasons and implications for these trends. The Index does not answer the question of who is responsible for factionalization or grievance or which policies may have contributed to improvements in the economy or public services or whether those improvements meet reasonable targets of achievement. Those are for others to hash out. But the tool can help frame those discussions for constructive dialogue by stakeholders, especially if we do a better job of digging beneath the aggregate score and country ranking to look at indicator scores over time.